STOCKS TALK. WE TRANSLATE.
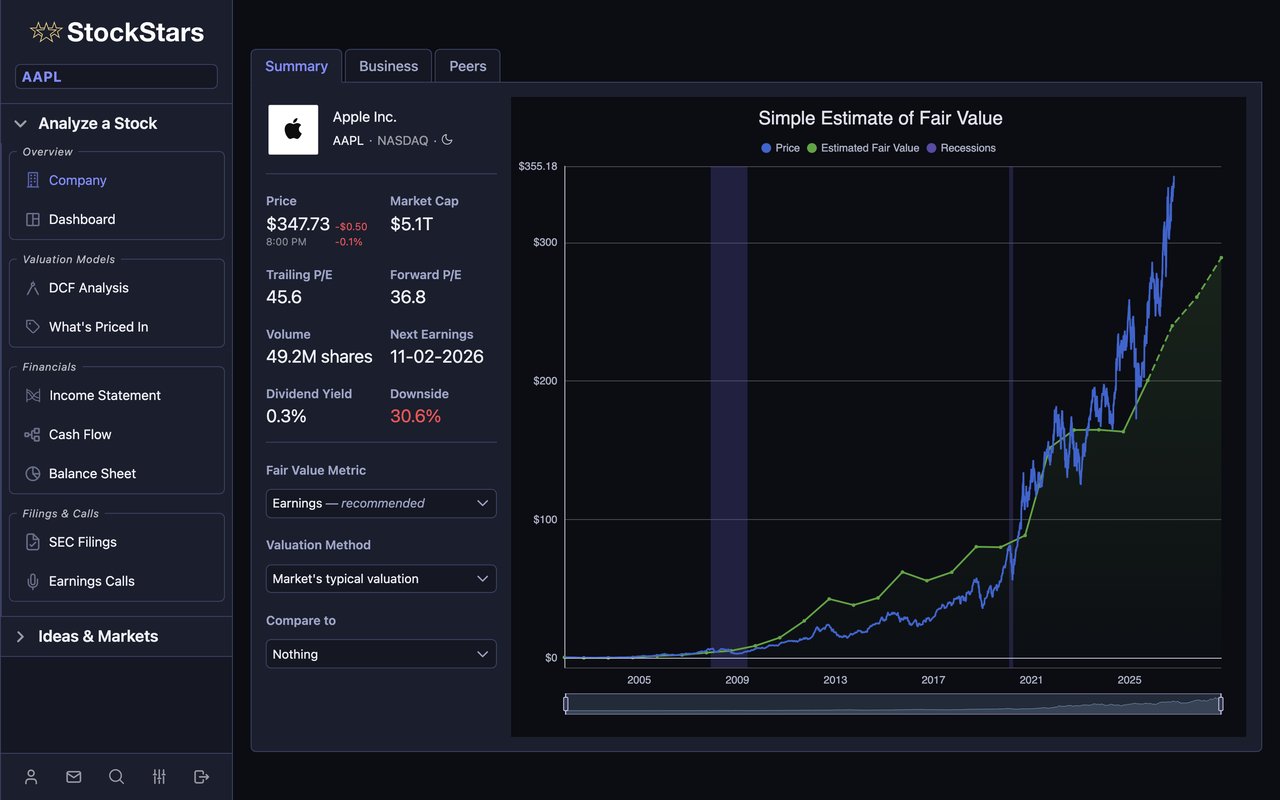
Here are just a few of the questions StockStars helps you answer...
What do great investors see that I don’t?
Explore the portfolios of well-known investors. See what they own, how their holdings change, and which industries they favor.
What growth is the market betting on?
See the revenue growth required to justify a stock’s price under your assumptions. Compare it with the company’s history and analyst estimates.
Where does each dollar of revenue go?
Follow revenue through costs, expenses, and profit, then check the cash coming in and the obligations ahead. The headline is only the beginning.
Where does the growth come from?
See where a company earns its revenue, and how that mix is changing year after year.
What’s happening around my stocks?
Put company research in context with the economy, interest rates, and market conditions.
...and that’s just the start of what you can discover
We built StockStars to fix the big things that frustrated us about other tools.
A DCF analysis you can trust and understand
Too many valuation tools hand you a number built on assumptions you can’t see or change. So why should you trust the results? StockStars, on the other hand, walks you through the DCF analysis and uses your research assumptions to calculate the final stock valuation.
Sign up for free to run a DCF analysis you can trust →Dashboard charts that come with context
A raw number says little on its own. For example, is a 12% margin good? Well, it depends on the industry. That's why our dashboard charts show peer data by default, so you can tell what’s normal for a company in that industry.
Sign up for free to see your stocks in context →A dashboard that fits how you work
Fixed layouts make you dig past charts you don’t care about to find the ones you do. Start with a view built for investors like you, then arrange it around your own workflow.
Sign up for free to build a dashboard that fits how you work →JOIN STOCKSTARS AND BECOME A BETTER INVESTOR!